Nielsen’s “The Gauge” bugs me
They’ve been producing a report called “The Gauge” for a while and this chart has always bugged me:
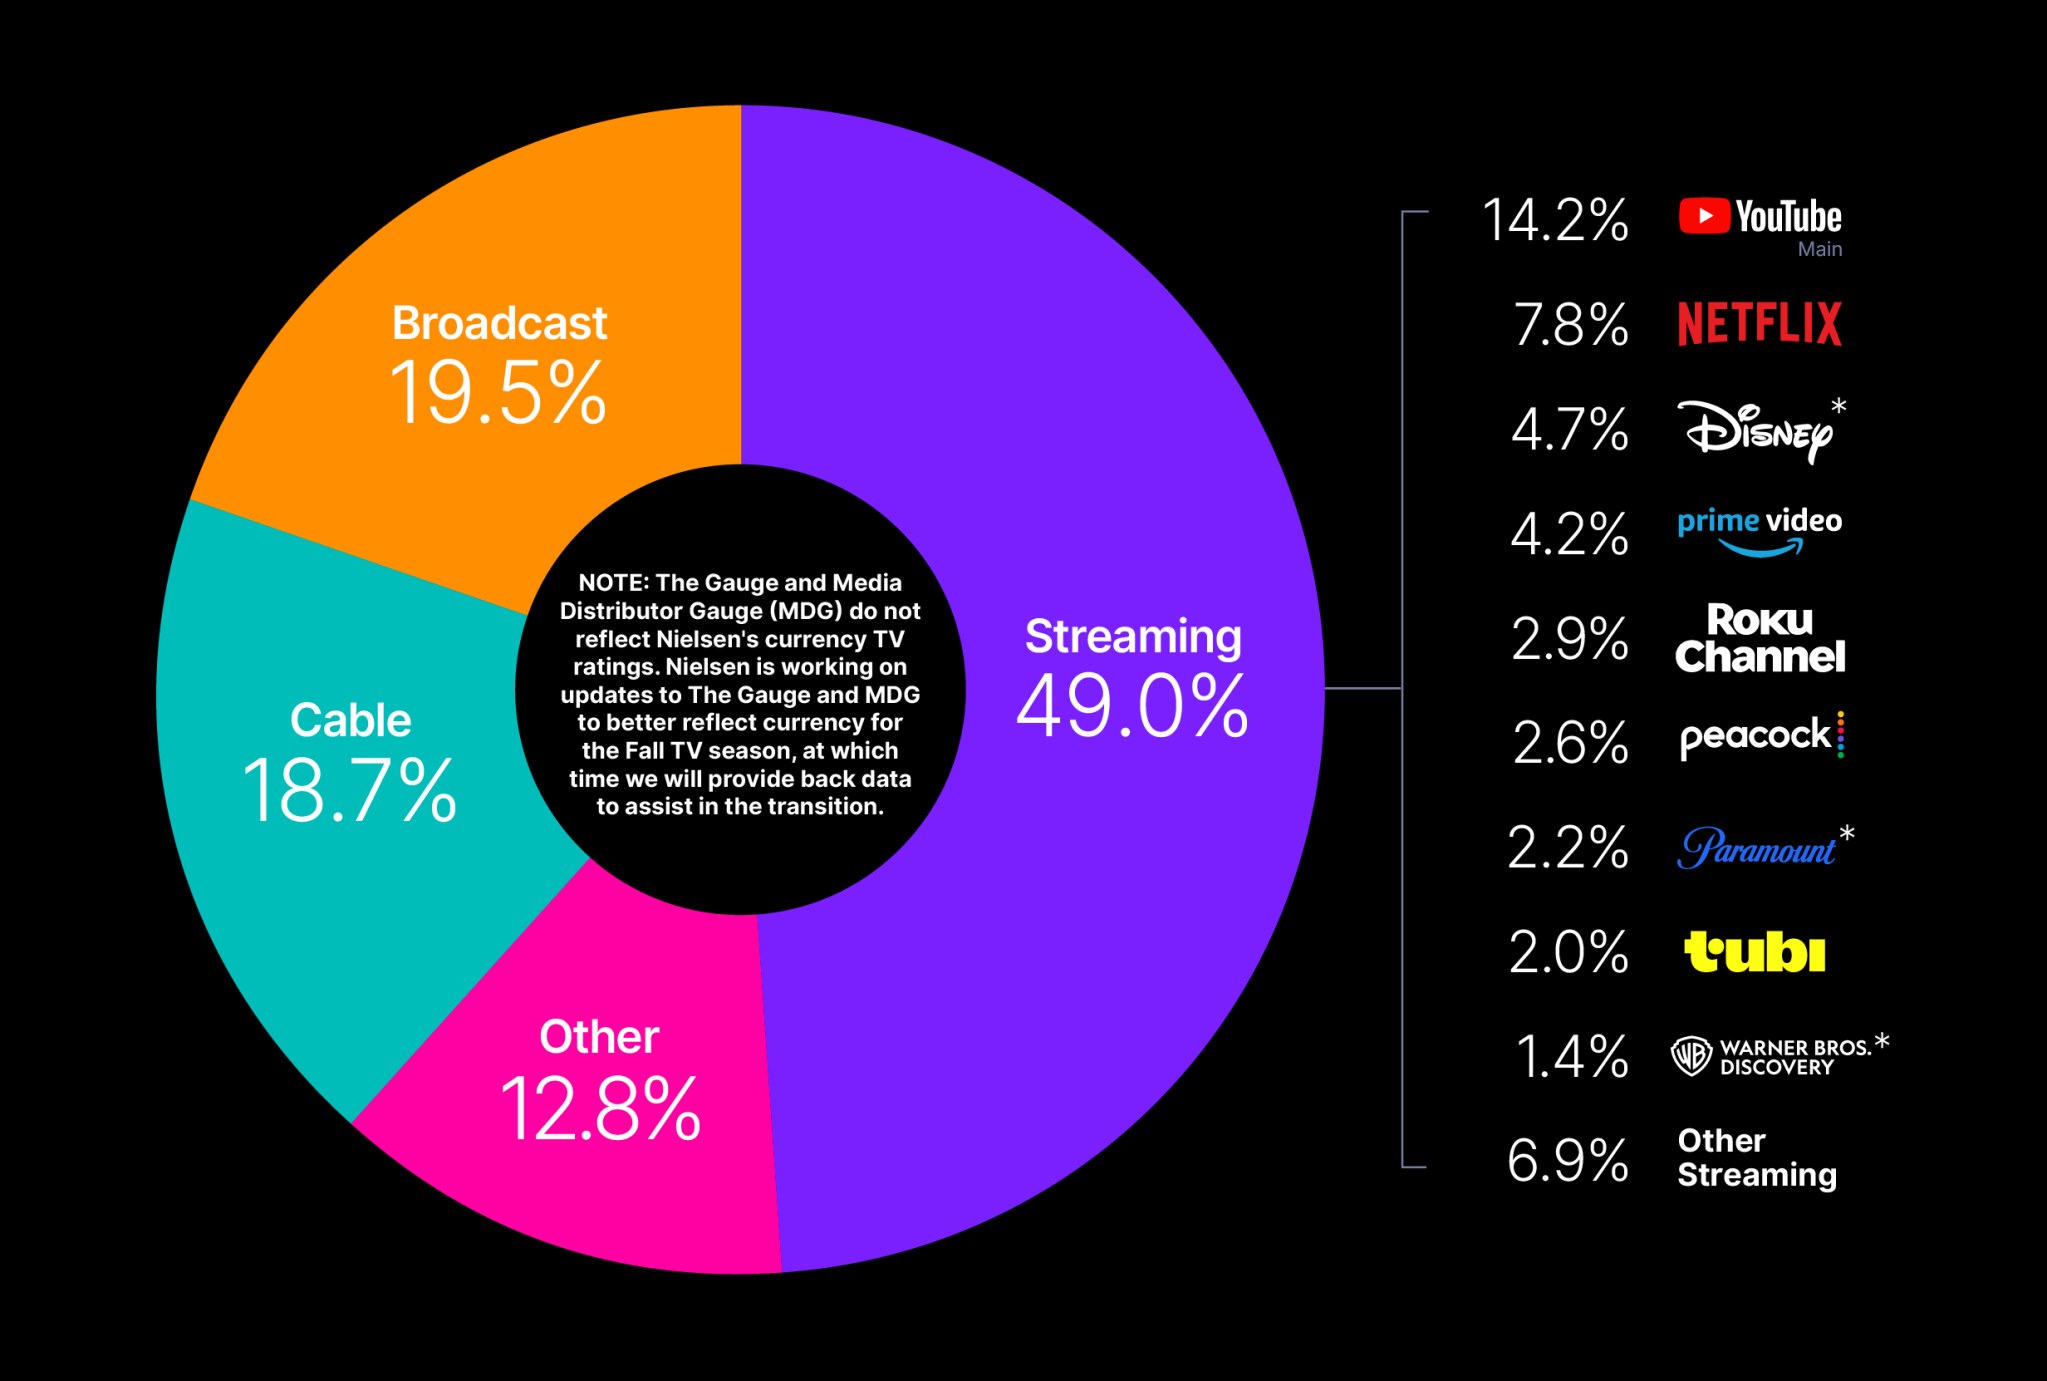
You’ve got this mix of distribution and channel that doesn’t give you an accurate picture of either. Back in February of 2023 they changed the methodology to put vMVPD viewership (YouTubeTV, Hulu Live, etc) into Broadcast and Cable instead of Streaming. I can understand why they did that, but I think it’s still misleading. vMVPDs make up ~33% of “cable subscriptions” which is also how most people are watching broadcast. The core issue is that they’re mixing two dimensions of one metric in a single chart.